Question:
Suppose you observe a series of interference maxima and plot sinθm vs. for those maxima. What type of graph would you expect get? Describe not only the shape of the graph but also the parameters that would describe it.
Interference Pattern:
The interference is the phenomenon where the light superimposed after passing from the slit. When the light interferes constructively, then the bright fringes formed or we can say maxima. When the path difference between the waves is an integral multiple of the wavelength, then the maxima forms.
Answer and Explanation:
 |
The Path difference between the waves is given by the following expression
δx=dsinθm
where
- d is the slit width
- θm is the angular position of the fringe
When the path difference is equal to the integral multiple of the wavelength, then the constructive interference or maxima forms, therefore
δx=mλdsinθm=mλsinθ=λdm
where
- m is the order of the fringe
- λ is the wavelength
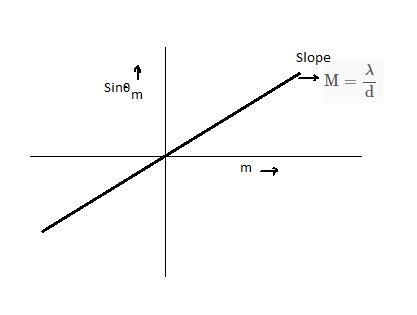
For the plot of the sinθm vs m
the above equation resembles with the equation of the straight line passing through the origin i.e. y=Mx
where "M" represents the slope of the graph which would be equal to, M=λd


0 Comments
If you have any doubts,please let me know.